Page 92 - Azerbaijan State University of Economics
P. 92

THE                      JOURNAL OF ECONOMIC SCIENCES: THEORY AND PRACTICE, V.81, # 2, 2024, pp. 84-103

                    The collected data were analyzed using both descriptive and inferential statistics with the
                    assistance  of  the  Statistical  Package  for  the  Social  Sciences  (SPSS)  version  27.
                    Descriptive statistics were utilized to summarize the demographic characteristics of the
                    participants, while linear regression analysis was conducted to test the hypotheses. This
                    study adhered to the LASU Research Ethics Policy (2020), ensuring the protection of
                    participants’  rights,  maintaining  research  integrity,  and  upholding  confidentiality
                    throughout the research process.

                    FINDINGS AND DISCUSSION

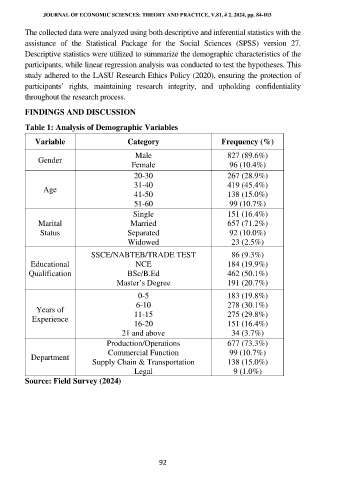
                    Table 1: Analysis of Demographic Variables
                       Variable                   Category                    Frequency (%)

                                                    Male                        827 (89.6%)
                        Gender
                                                   Female                       96 (10.4%)
                                                    20-30                       267 (28.9%)
                                                    31-40                       419 (45.4%)
                         Age
                                                    41-50                       138 (15.0%)
                                                    51-60                       99 (10.7%)
                                                    Single                      151 (16.4%)
                        Marital                    Married                      657 (71.2%)
                        Status                    Separated                     92 (10.0%)
                                                  Widowed                        23 (2.5%)
                                       SSCE/NABTEB/TRADE TEST                    86 (9.3%)
                     Educational                    NCE                         184 (19.9%)
                     Qualification                BSc/B.Ed                      462 (50.1%)
                                               Master’s Degree                  191 (20.7%)
                                                     0-5                        183 (19.8%)
                                                     6-10                       278 (30.1%)
                       Years of
                      Experience                    11-15                       275 (29.8%)
                                                    16-20                       151 (16.4%)
                                                21 and above                     34 (3.7%)
                                            Production/Operations               677 (73.3%)
                                            Commercial Function                 99 (10.7%)
                      Department
                                        Supply Chain & Transportation           138 (15.0%)
                                                    Legal                        9 (1.0%)
                    Source: Field Survey (2024)


                                                           92
   87   88   89   90   91   92   93   94   95   96   97