
Page 94 - Azerbaijan State University of Economics
P. 94
THE JOURNAL OF ECONOMIC SCIENCES: THEORY AND PRACTICE, V.81, # 2, 2024, pp. 84-103
This distribution suggests that initiatives aimed at improving resource efficiency and eco-
friendly practices should primarily focus on the production/operations and supply chain
and transportation departments, where most employees are concentrated and where
significant environmental impacts can be managed.
Test of Hypotheses
To test the hypotheses, preliminary diagnostic analysis of the skewness and kurtosis
for the variables indicates that the data distributions are approximately symmetrical
and normal. The skewness values for climate change attitudinal responses (0.25),
action orientation (0.10), resource efficiency (0.12), and eco-friendly practices (0.35),
ranging from 0.10 to 0.35, are close to zero, suggesting minimal asymmetry in the
data. The kurtosis values for climate change attitudinal responses (0.3), action
orientation (0.4), resource efficiency (0.2), and eco-friendly practices (0.5), ranging
from 0.2 to 0.5, are within the acceptable range of 0 to 1, indicating that the data do
not exhibit extreme deviations in terms of peakedness or tails.
Furthermore, the VIF values for climate change attitudinal responses (1.5), action
orientation (2.0), resource efficiency (1.8), and eco-friendly practices (1.7), all below
the threshold of 10, confirming that multicollinearity is not a significant issue among
the predictor variables, ensuring their independence. These statistical measures
collectively validate the appropriateness of using linear regression to test the
hypotheses.
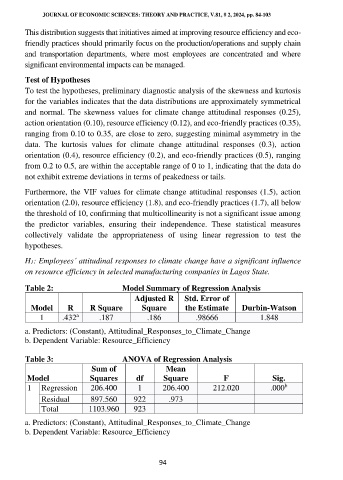
H1: Employees’ attitudinal responses to climate change have a significant influence
on resource efficiency in selected manufacturing companies in Lagos State.
Table 2: Model Summary of Regression Analysis
Adjusted R Std. Error of
Model R R Square Square the Estimate Durbin-Watson
a
1 .432 .187 .186 .98666 1.848
a. Predictors: (Constant), Attitudinal_Responses_to_Climate_Change
b. Dependent Variable: Resource_Efficiency
Table 3: ANOVA of Regression Analysis
Sum of Mean
Model Squares df Square F Sig.
b
1 Regression 206.400 1 206.400 212.020 .000
Residual 897.560 922 .973
Total 1103.960 923
a. Predictors: (Constant), Attitudinal_Responses_to_Climate_Change
b. Dependent Variable: Resource_Efficiency
94