
Page 100 - Azerbaijan State University of Economics
P. 100
CONTRIBUTION OF BANKING SYSTEM INTO FINANCIAL STABILITY OF UKRAINE
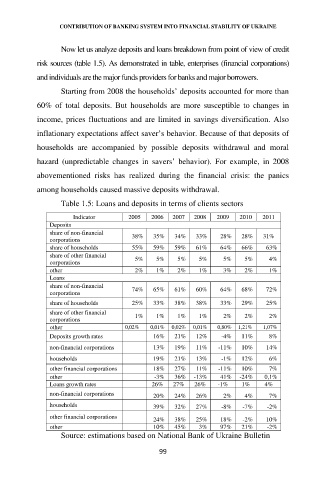
Now let us analyze deposits and loans breakdown from point of view of credit
risk sources (table 1.5). As demonstrated in table, enterprises (financial corporations)
and individuals are the major funds providers for banks and major borrowers.
Starting from 2008 the households’ deposits accounted for more than
60% of total deposits. But households are more susceptible to changes in
income, prices fluctuations and are limited in savings diversification. Also
inflationary expectations affect saver’s behavior. Because of that deposits of
households are accompanied by possible deposits withdrawal and moral
hazard (unpredictable changes in savers’ behavior). For example, in 2008
abovementioned risks has realized during the financial crisis: the panics
among households caused massive deposits withdrawal.
Table 1.5: Loans and deposits in terms of clients sectors
Indicator 2005 2006 2007 2008 2009 2010 2011
Deposits
share of non-financial 38% 35% 34% 33% 28% 28% 31%
corporations
share of households 55% 59% 59% 61% 64% 66% 63%
share of other financial 5% 5% 5% 5% 5% 5% 4%
corporations
other 2% 1% 2% 1% 3% 2% 1%
Loans
share of non-financial 74% 65% 61% 60% 64% 68% 72%
corporations
share of households 25% 33% 38% 38% 33% 29% 25%
share of other financial 1% 1% 1% 1% 2% 2% 2%
corporations
other 0,02% 0,01% 0,02% 0,01% 0,80% 1,21% 1,07%
Deposits growth rates 16% 21% 12% -4% 11% 8%
non-financial corporations 13% 19% 11% -11% 10% 14%
households 19% 21% 13% -1% 12% 6%
other financial corporations 18% 27% 11% -11% 10% 7%
other -3% 36% -13% 41% -24% 0,1%
Loans growth rates 26% 27% 26% -1% 1% 4%
non-financial corporations 20% 24% 26% 2% 4% 7%
households 39% 32% 27% -8% -7% -2%
other financial corporations
24% 38% 25% 18% -2% 10%
other 10% 45% 3% 97% 21% -2%
Source: estimations based on National Bank of Ukraine Bulletin
99