
Page 96 - Azerbaijan State University of Economics
P. 96
CONTRIBUTION OF BANKING SYSTEM INTO FINANCIAL STABILITY OF UKRAINE
Table 1.2: Dynamics of financial indicators of banking activity in Ukraine in 2005-2011
Indicator 2005 2006 2007 2008 2009 2010 2011
Equity, % GDP 4,2 4,8 6,0 7,4 13,3 11,7 10,8
Assets, % GDP 30,5 39,0 47,2 63,1 101,5 82,3 71,8
Liabilities, % GDP 26,2 34,2 41,2 55,7 88,2 70,6 61,1
Net profit/loss, % GDP 0,3 0,4 0,6 0,7 0,8 -2,9 -1,0
Equity-to-Assets Ratio 0,16 0,14 0,15 0,13 0,15 0,17 0,18
Regulatory capital to risk- 15,0 14,2 13,9 14,0 18,1 20,8 18,9
weighted assets ratio, %
NPLs net of provision to capital 326,0 352,4 313,8 9,2 32,0 29,2 25,8
ratio, %
Liquid assets to total assets 18,0 14,3 11,6 9,4 11,5 10,2 10,6
ratio, %
NPLs to total loans ratio, % 58,0 59,8 48,1 3,9 13,7 15,3 14,7
ROA, % 1,3 1,3 1,2 0,9 4,4 -1,4 -0,7
ROE, % 10,4 11,4 10,5 7,3 -32,3 -9,7 -5,0
Interest margin to gross income 48,4 54,5 60,8 53,0 61,1 61,9 63,1
ratio, %
Source: estimations based on National Bank of Ukraine Bulletin;
Preliminary results of banking activity (NBU, March 2012); Financial
Soundness Indicator (IMF, July 2012)
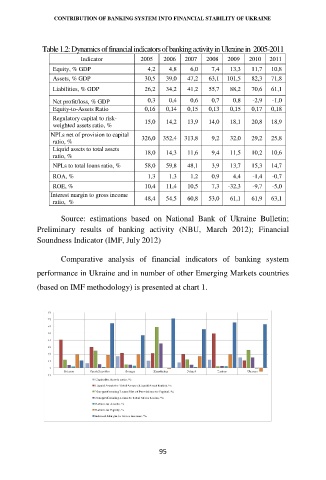
Comparative analysis of financial indicators of banking system
performance in Ukraine and in number of other Emerging Markets countries
(based on IMF methodology) is presented at chart 1.
95