
Page 17 - Azerbaijan State University of Economics
P. 17
Aimene Farid, Bahi Nawel:Operational Risk Estimation Using the Value-at-Risk (VAR)
Method: Case Study of the External Bank of Algeria (EBA)
−
~ ( = ) ; ( ) = . ⁄ ! (1)
where: n: the frequency (number) of events in a year. f(n): the probability that n
events will occur in a year.
: Average, where: = ∑ = =
⁄
⁄
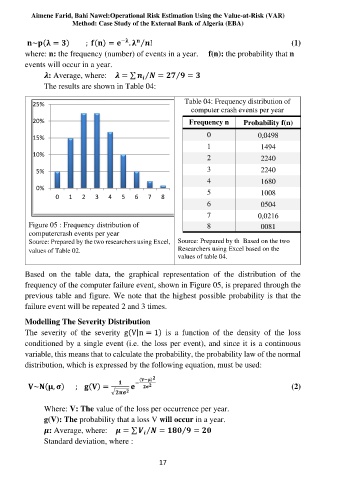
The results are shown in Table 04:
Table 04: Frequency distribution of
25%
computer crash events per year
20% Frequency n Probability f(n)
0 0,0498
15%
1 1494
10% 2 2240
5% 3 2240
4 1680
0% 5 1008
0 1 2 3 4 5 6 7 8
6 0504
7 0,0216
Figure 05 : Frequency distribution of 8 0081
computercrash events per year
Source: Prepared by the two researchers using Excel, Source: Prepared by th Based on the two
values of Table 02. Researchers using Excel based on the
values of table 04.
Based on the table data, the graphical representation of the distribution of the
frequency of the computer failure event, shown in Figure 05, is prepared through the
previous table and figure. We note that the highest possible probability is that the
failure event will be repeated 2 and 3 times.
Modelling The Severity Distribution
The severity of the severity g(V|n = 1) is a function of the density of the loss
conditioned by a single event (i.e. the loss per event), and since it is a continuous
variable, this means that to calculate the probability, the probability law of the normal
distribution, which is expressed by the following equation, must be used:
( − )
−
~ ( , ) ; ( ) = (2)
√
Where: V: The value of the loss per occurrence per year.
g(V): The probability that a loss V will occur in a year.
: Average, where: = ∑ = =
⁄
⁄
Standard deviation, where :
17