
Page 22 - Azerbaijan State University of Economics
P. 22
THE JOURNAL OF ECONOMIC SCIENCES: THEORY AND PRACTICE, V.81, # 2, 2024, pp. 4-29
Through the previous table, we find that the average loss value is 456.125 million
DZD with a standard deviation of 526.36 million DZD, i.e.V~N(456.125; 526.36).
Based on the previous values and the normal distribution equation, we obtain the
severity distribution shown in the following table:
Table 11: Severity Distribution
Loss values (million Probability Loss values (million Probability
DZD) DZD)
1 0,00052153 1,000 0,00044441
2 0.00052238 1100 0.00035867
3 0,00052324 1200 0,00027921
4.5 0,00052452 1300 0,00020965
10 0.00052922 1400 0.00015183
20 0,00053771 1500 0,00010607
50 0.0005628 1600 7,1467E-05
100 0.00060287 1700 4,6447E-05
200 0,0006733 1800 2,9117E-05
300 0.00072531 1900 1,7605E-05
400 0,00075363 2000 1,0268E-05
500 0.0007553 2100 5,776E-06
600 0.00073013 2200 3,1341E-06
700 0,00068079 23 1, 6402E-06
800 0,00061227 2400 8,2801E-07
900 0,00053113 2500 4,0317E-07
Source: Prepared by the two researchers using Excel, based on the values of Table 10.
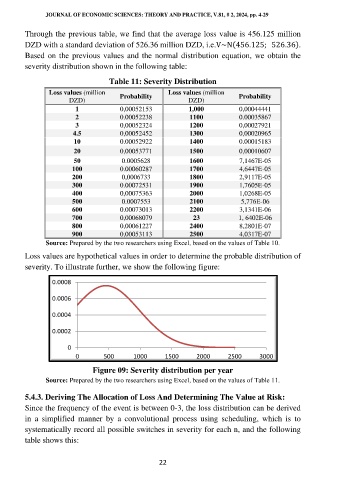
Loss values are hypothetical values in order to determine the probable distribution of
severity. To illustrate further, we show the following figure:
0.0008
0.0006
0.0004
0.0002
0
0 500 1000 1500 2000 2500 3000
Figure 09: Severity distribution per year
Source: Prepared by the two researchers using Excel, based on the values of Table 11.
5.4.3. Deriving The Allocation of Loss And Determining The Value at Risk:
Since the frequency of the event is between 0-3, the loss distribution can be derived
in a simplified manner by a convolutional process using scheduling, which is to
systematically record all possible switches in severity for each n, and the following
table shows this:
22