Page 18 - Azerbaijan State University of Economics
P. 18

THE                      JOURNAL OF ECONOMIC SCIENCES: THEORY AND PRACTICE, V.81, # 2, 2024, pp. 4-29

                                                         n
                                                           1
                                                                     2
                                                    = √∑     (V − μ)   
                                                           N   i
                                                        i=1

                    As a first stage, we calculate the standard deviation of loss values, and the following
                    table shows this:

                          Table 05: Calculation of Average and Standard Deviation of Loss Values
                                                    (Thousand DZD)
                                                Loss Value Vi              −             /  (   −   )


                              V1                     50                 30,00              900
                              V2                     4                 (16, 00)            256
                              V3                     12                (8, 00)             64
                              V4                     44                 24,00              576
                              V5                     2                 (18:00)             324
                              V6                     36                 16,00              256
                              V7                     11                 (9, 00             81
                              V8                     18                 ≤ 2.00              4
                              V9                     3                 (17, 00)            289
                             Total                  180                   -              2 750,00
                               µ                     20                  σ²                305
                                                                         Σ                17.48
                    Source: Prepared by the two researchers using Excel, based on the values of Table 02.

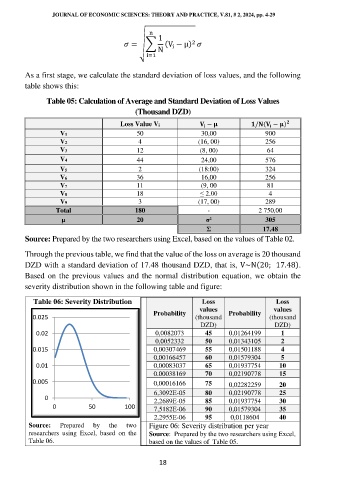
                    Through the previous table, we find that the value of the loss on average is 20 thousand
                    DZD with a standard deviation of 17.48 thousand DZD, that is, V~N(20;   17.48).
                    Based on the previous values and the normal distribution equation, we obtain the
                    severity distribution shown in the following table and figure:

                      Table 06: Severity Distribution                   Loss                  Loss
                                                                       values                values
                                                          Probability           Probability
                      0.025                                           (thousand             (thousand
                                                                        DZD)                  DZD)
                       0.02                               0,0082073      45     0,01264199     1
                                                          0,0052332      50     0,01343105     2
                      0.015                               0,00307469     55     0,01501188     4
                                                          0,00166457     60     0,01579304     5
                       0.01                               0,00083037     65     0,01937754     10
                                                          0.00038169     70     0,02190778     15
                      0.005                               0,00016166     75     0,02282259     20
                                                          6,3092E-05     80     0,02190778     25
                          0
                                                          2,2689E-05     85     0,01937754     30
                            0          50        100      7,5182E-06     90     0,01579304     35
                                                          2,2955E-06     95      0,0118604     40
                     Source:   Prepared   by   the   two     Figure 06: Severity distribution per year
                     researchers  using  Excel,  based  on  the      Source:  Prepared by the two researchers using Excel,
                     Table 06.                          based on the values of  Table 05.


                                                           18
   13   14   15   16   17   18   19   20   21   22   23