
Page 20 - Azerbaijan State University of Economics
P. 20
THE JOURNAL OF ECONOMIC SCIENCES: THEORY AND PRACTICE, V.81, # 2, 2024, pp. 4-29
We note from the previous table that for each random repetition random loss values
were set according to the number of repetitions and then we added the loss values
together. As for the probability, the probability of each loss value as well as the
probability of repetition is multiplied. For example, we take the first line from the
previous table, which contains the repetition 4 and the folloing loss values: 8, 27, 22 ,
3 thousand DZD, from which the common probability is calculated based on the
Poisson distribution of repetitions and the normal distribution of loss values as
follows:
0.168 × 0.0180314 × 0.021064 × 0.022673 × 0.0142227 =2,0577 E-08
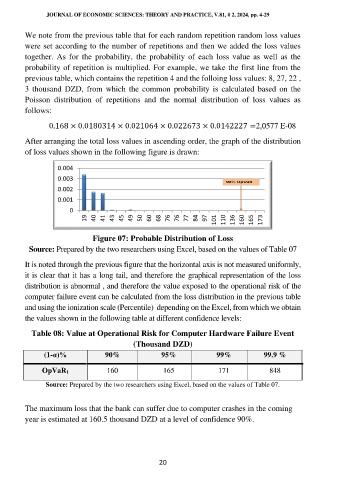
After arranging the total loss values in ascending order, the graph of the distribution
of loss values shown in the following figure is drawn:
0.004
0.003
0.002
0.001
0
19 40 41 43 45 49 50 60 68 76 76 77 84 97 101 110 136 160 165 173
Figure 07: Probable Distribution of Loss
Source: Prepared by the two researchers using Excel, based on the values of Table 07
It is noted through the previous figure that the horizontal axis is not measured uniformly,
it is clear that it has a long tail, and therefore the graphical representation of the loss
distribution is abnormal , and therefore the value exposed to the operational risk of the
computer failure event can be calculated from the loss distribution in the previous table
and using the ionization scale (Percentile) depending on the Excel, from which we obtain
the values shown in the following table at different confidence levels:
Table 08: Value at Operational Risk for Computer Hardware Failure Event
(Thousand DZD)
(1-α)% 90% 95% 99% 99.9 %
OpVaR1 160 165 171 848
Source: Prepared by the two researchers using Excel, based on the values of Table 07.
The maximum loss that the bank can suffer due to computer crashes in the coming
year is estimated at 160.5 thousand DZD at a level of confidence 90%.
20