
Page 19 - Azerbaijan State University of Economics
P. 19
Aimene Farid, Bahi Nawel:Operational Risk Estimation Using the Value-at-Risk (VAR)
Method: Case Study of the External Bank of Algeria (EBA)
The loss values shown in the previous table are hypothetical in order to determine the
probable distribution of the severity of the loss.
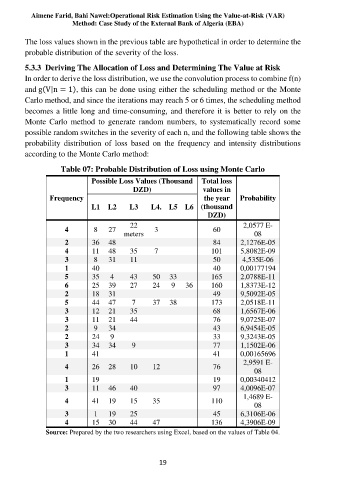
5.3.3 Deriving The Allocation of Loss and Determining The Value at Risk
In order to derive the loss distribution, we use the convolution process to combine f(n)
and g(V|n = 1), this can be done using either the scheduling method or the Monte
Carlo method, and since the iterations may reach 5 or 6 times, the scheduling method
becomes a little long and time-consuming, and therefore it is better to rely on the
Monte Carlo method to generate random numbers, to systematically record some
possible random switches in the severity of each n, and the following table shows the
probability distribution of loss based on the frequency and intensity distributions
according to the Monte Carlo method:
Table 07: Probable Distribution of Loss using Monte Carlo
Possible Loss Values (Thousand Total loss
DZD) values in
Frequency the year Probability
L1 L2 L3 L4. L5 L6 (thousand
DZD)
22 2,0577 E-
4 8 27 3 60
meters 08
2 36 48 84 2,1276E-05
4 11 48 35 7 101 5,8082E-09
3 8 31 11 50 4,535E-06
1 40 40 0,00177194
5 35 4 43 50 33 165 2,0788E-11
6 25 39 27 24 9 36 160 1,8373E-12
2 18 31 49 9,5092E-05
5 44 47 7 37 38 173 2,0518E-11
3 12 21 35 68 1,6567E-06
3 11 21 44 76 9,0725E-07
2 9 34 43 6,9454E-05
2 24 9 33 9,3243E-05
3 34 34 9 77 1,1502E-06
1 41 41 0,00165696
4 26 28 10 12 76 2,9591 E-
08
1 19 19 0,00340412
3 11 46 40 97 4,0096E-07
4 41 19 15 35 110 1,4689 E-
08
3 1 19 25 45 6,3106E-06
4 15 30 44 47 136 4,3906E-09
Source: Prepared by the two researchers using Excel, based on the values of Table 04.
19